In this activity students will explore the theoretical limits of a grating spectrometer to resolve two distinct wavelengths in a light source. The student should develop an understanding of how wavelength λ, grating spacing d , the number of grating rulings N and order of diffraction m affect the ability of a spectrometer to discern whether there are two wavelengths present of just one.
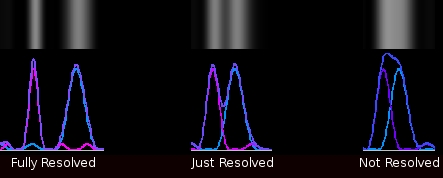
The standard way to define two to intensity peaks as “just resolvable” is Rayleigh's Resolution Criteria which states that two intensity peaks are barely resolved if the maximum of one pattern coincides with the adjacent minimum of the other pattern. While this definition lends it self to theoretical analysis, we are going to use a cruder more visual definition: two sources of different wavelengths but identical intensity are just resolvable if the intensity valley between the two peaks is at the halfway point of the two peaks. This definition will suffice to allow an investigation of the limits of resolution but should not be taken beyond the scope of this exercise.
Set the slit size to zero (by setting the a/d slider to 0.0) which will treat each slit as a point source. This will simplify the diffraction pattern a bit. Set the number of slits N to 5 and the slit spacing d to 1.50 μm. In Plot Intensities Options, select I1+I2 and deselect both I1 and I2 so that only the total intensity is displayed.
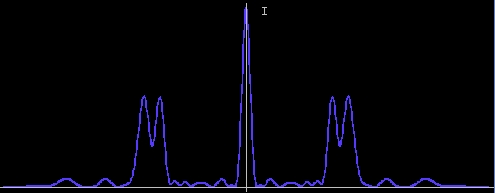
Set λ1 to .4 μm (which will be the nominal wavelength) and adjust λ2 so that λ2 is greater than λ1 and the two wavelengths are just resolved by our criteria above. The resulting intensity plot should resemble the figure below. Note the value of Δλ which is how close two sources can be in wavelength and still detect that there are two distinct wavelengths present.
Now double the number of slits N to 10, and adjust λ2 so that the two wavelengths are just resolved with this new configuration. What is the new value of Δλ? It should be about half the previous result. Thus, doubling the number of slits halves the limit at which two wavelengths can be resolved. Repeat this for N = 4,6,8, and 12 and plot 1/Δλ versus N. The result should be a fairly straight line through the origin, indicating that Δλmin is inversely proportional to N. Thus increasing N increases the ability to resolve details in a spectrum.
Set the number of slits N to 5, and set λ1 = .5 μm. Adjust λ2 so that λ2 is greater than λ1 and the two wavelengths are just resolved by our criteria. Note that Δλ. is now greater than when the nominal wavelength was .4 μm. Repeat for λ1 = .3, .45, and .6 μm and plot Δλ versus λ1. Be careful when examining the .3 case, as the second order diffraction peaks are also visible (we are only looking at first order peaks in this exercise). The result should be linear indicating that Δλmin is proportional to the nominal wavelength. Thus it is more difficult to resolve details in a spectrum at higher wavelengths.
Again, set the number of slits N to 5, and set λ1 = .4 μm and adjust λ2 so that λ2 is greater than λ1 and the two wavelengths are just resolved by our criteria. Now try adjusting the slit separation d, and note what happens when d is increased and decreased. Do the two wavelengths become more or less “resolved”? (i.e. does the minimum between the peaks increase or decrease?). One of the things you should observe is that when you increase d, the 2nd and possible 3rd order peaks appear. If the two colors are barely resolved in first order, is the separation of the diffraction peaks better, worse or the same in second order?
Given the proportionalities discussed above, estimate the minimum number of slits necessary to resolve (in 1st order) a spectral source which contains the two wavelengths λ1=.575 μm and λ2= .600 μm. Use the simulations to see how good your estimate was.