This activity is a graphical exploration of motion. Students will manipulate graphs which describe certain aspects of motion (such as postion versus time), and be able to immediately see the changes in other important graphs (such as velocity versus time). Students will also be able to "play" the graphs they construct and watch a virtual object undergo the motion described by their graphs.
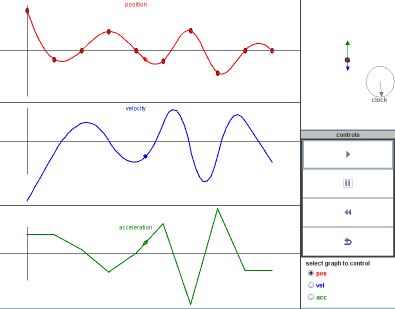
Figure 1: The applet in the mode to manipulate the position graph
The applet used in this exercise is shown in Figure 1. There are three graphs describing the motion of the object: the red graph shows position as a function of time, the blue graph shows velocity and the green graph shows acceleration. In the default mode, the motion is curve is manipulated by dragging the control points (indicated by the red dots on the curve) vertically. Try reshaping the graph by dragging the points up and down (these control points cannot be moved left or right). Note how the velocity and the acceleration graphs automatically and immediately reflect the changes created by manipulating the position graph. The graphs are not independent!
To the right of the three graphs at the top is a display of the object (red circle) which is to undergo the described motion. The instantaneous velocity is shown as a blue arrow coming out of the object, and the acceleration is shown as a green arrow. A virtual "clock" displays the passage of time as the motion is being played.
Controls for the applet are located to the right of the graphs, below the object motion display. Pressing the start button will cause the object to undergo the motions described by the graph. Try this and see how the object moves according to your graph. Note how the position, velocity (blue arrow) and acceleration (green arrow) at each instant in time are related to the corresponding graphs. A marker is displayed on each graph showing the current state of the object. The pause button simply pauses the passage of time for the object's motion, and the reset time button sets the back to its initial state.
The radio buttons at the bottom of the conrtol section select how the graphs are to be manipulated. The default is to manipulate the position graph. If vel is selected instead, the complete velocity graph can be manipulated by a new set of control points in a similar manner to how the position graph was manipulated before, however the student manipulates the initial position by a single contol point at the start of the position graph. The setup is shown in figure 2. Try modifying the graphs in the vel mode.

Figure 2: The applet in the mode to manipulate the velocity graphs
Finally, if acc is selected instead, the mplete acceleration graph can be manipulated by its own set of control points, and the student manipulates both the initial position and initial velocity by a single contol points at the start of the corresponding graphs. The setup is shown in figure 3. Because of how the computer draws the curves for the three graphs (using a cubic spline for the position graph), the first two values of acceleration are always the same and the last two values of acceleration are the same. Try modifying the graphs in the acc mode.
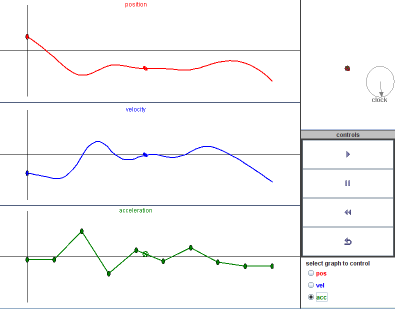
Figure 3: The applet in the mode to manipulate the acceleration graphs